DataLink Connect adds the processing power of your PC or Mac to Apperson test scanners. Exam data can be captured effortlessly for advanced item analysis and standards and objectives-based reporting. Data can also be exported to gradebook applications and programs such as Microsoft Excel® for further analysis.
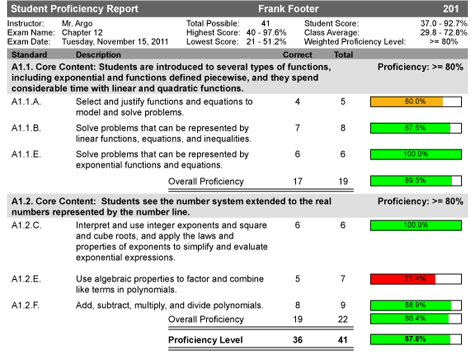
Student Proficiency Report
This report shows how an individual student performed within standards-based groups. The student proficiency report is available when standards/learning objectives and proficiencies have been added to the answer key.
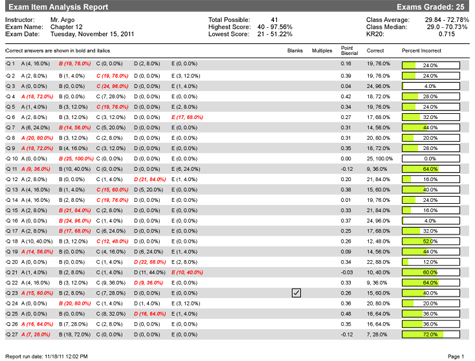
Exam Item Analysis
A detailed report showing the number of questions and the percentage of all answers selected for each question within a given exam. The correct answers are highlighted and a bar graph with the percentage of incorrect answers is displayed to indicate validity of the questions and material coverage.
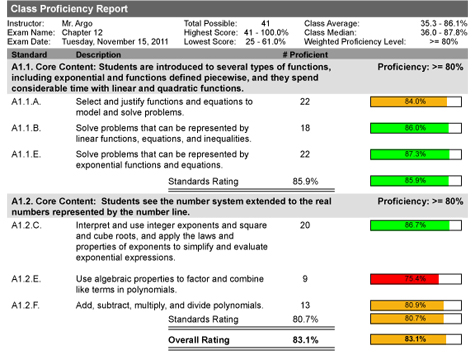
Class Proficiency Report
This report shows how many students were considered proficient within each standard or learning outcome tested. Proficiency levels are user-selectable. The class proficiency report is available when standards/learning outcomes and proficiencies have been added to the answer key.
Class Proficiency Item Analysis
This report combines important data from two popular reports which allows you to view an overall proficiency level for each standard or learning objective assessed along with the number of times each response was chosen. The correct answer is highlighted in red and the overall proficiency associated with each standard is shown in the bar graph to the right. Proficiency levels are user selectable.
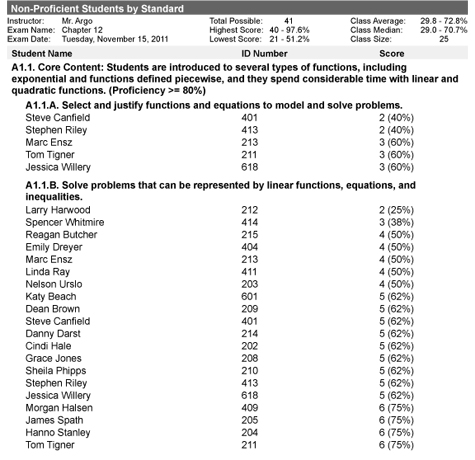
Non-Proficient Students by Standard
This report shows all students that did not meet the proficiency levels set for a test. The standard or learning objective is shown along with the information for each student including their name, student ID number and score. Student ID numbers and names will only show if the students have been added into the student database.
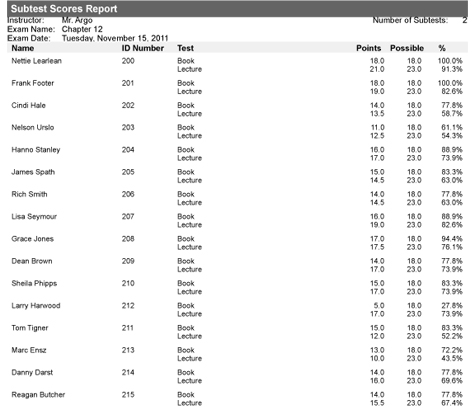
Subtests Scores Report
This powerful report shows how an individual student performed within the various subtest categories on a test. It will show each students’ score for the individual subtest category including the number of correct responses, total questions per subtest, students score in percentage as well as overall points. Student ID numbers and names will only show if the students have been added into the student database.